


Abstract
Recent studies indicate that the choroid plexus has important physiologic and pathologic roles in Alzheimer disease (AD). To obtain additional insight on choroid plexus function, we performed a proteomic analysis of choroid plexus samples from patients with AD stages I to II (n = 16), III to IV (n = 16), and V to VI (n = 11) and 7 age-matched control subjects. We used 2-dimensional differential gel electrophoresis coupled with mass spectrometry to generate a complete picture of changes in choroid plexus protein expression occurring in AD patients. We identified 6 proteins: 14-3-3 β/α, 14-3-3 ε, moesin, proteasome activator complex subunit 1, annexin V, and aldehyde dehydrogenase, which were significantly regulated in AD patient samples (p < 0.05, >1.5-fold variation in expression vs control samples). These proteins are implicated in major physiologic functions including mitochondrial dysfunction and apoptosis regulation. These findings contribute additional significance to the emerging importance of molecular and functional changes of choroid plexus function in the pathophysiology of AD.
Introduction
Alzheimer disease (AD) is a progressive neurodegenerative disorder and the most common cause of dementia in elderly populations ( 1, 2 ). It is characterized by the accumulation of amyloid β (Aβ) in brain structures such as the hippocampus and the cerebral cortex. Amyloid β accumulation has also been found in blood vessels ( 3 ) and, importantly, in the choroid plexus ( 4, 5 ). The accumulation of Aβ peptides in the choroid plexus is to a great extent responsible for an increased level of oxidative stress and cell death in this structure ( 5, 6 ). Decreased activity of the enzymes involved in oxidative phosphorylation ( 7 ) and mitochondrial activity ( 5 ) may also contribute to impaired protein synthesis in the choroid plexus. The decrease in the functional activity of the choroid plexus is in part correlated with the decrease in protein secretion and renewal of the cerebrospinal fluid (CSF), which may be involved in the initiation and progression of AD. This impairment in transport/clearance function is coupled with the production of Aβ in the diseased choroid plexus ( 8 ). Thus, the Aβ measured in the CSF for diagnosis contains both brain- and choroid plexus–derived Aβ. The choroid plexus in AD patients exhibits cellular atrophy, decreased CSF production, enzymatic and metabolic activities, and impaired capacity for the efflux and clearance of molecules and therefore has a major impact on brain function ( 9–11 ).
An increased appreciation of the importance of Aβ accumulation in brain microvessel endothelial cells has recently improved research efforts toward understanding the blood-brain barrier, defined by cerebral vasculature, in the context of AD. In contrast to the blood-brain barrier, the blood-CSF barrier, defined by the choroid plexus, has received limited interest and is significantly understudied. The blood-CSF barrier is formed by the choroid plexus epithelial cells connected by tight junctions that physically restrict movement of substances. Ultrastructurally, epithelial cells of the choroid plexus contain numerous mitochondria necessary to maintain its high respiratory metabolism and energy requirements. Underlying the epithelial cells and basal lamina is a dense vascular bed with fenestrated capillaries. Although the best-recognized function of the choroid plexus is CSF production, the choroid plexus also synthesizes a large number of neuropeptides, growth factors, and cytokines ( 12 ). The choroid plexus develops early during embryogenesis and already constitutes a functional barrier within the first weeks of gestation. How the blood-CSF barrier responds to stimuli, including circulating inflammatory stimuli, is not understood. It should be noted that communication between the periphery and the brain through the brain barriers is compromised in AD ( 10 ). Pathogenic processes, such as mitochondrial activity deficits, oxidative stress, and morphologic structural changes, contribute to decreased efficacy of the choroid plexus in clearing Aβ, thus resulting in an accumulation of Aβ in the brain ( 13 ). Moreover, the blood-CSF barrier homeostatic mechanisms participate in neuropathologic processes observed in AD. In addition, many of the proteins specifically related to the choroid plexus, including Aβ ligands, are significantly diminished in AD ( 9 ).
To gain additional insight into the functional role of the choroid plexus in early stages and progression of AD pathology, we performed a molecular characterization of the choroid plexus from AD patients using 2-dimensional difference gel electrophoresis (2D-DIGE) using well-characterized autopsy samples from patients with AD-related pathology (Braak and Braak stages I–VI) and age-matched controls (i.e. no clinical symptoms and no neuropathologic lesions). We then applied mass spectrometry (MS) to identify the choroid plexus proteins associated with AD.
Materials and Methods
Tissue Samples
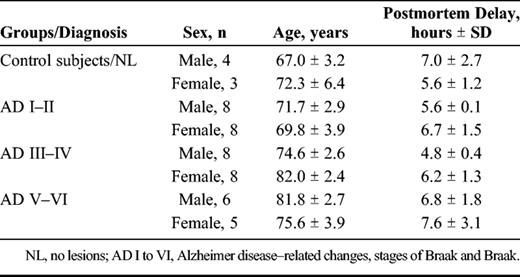
Alzheimer disease and control postmortem frozen tissue was obtained from the Institute of Neuropathology Brain Bank IDIBELL–Hospital Universitari de Bellvitge (Hospitalet de Llobregat, Barcelona, Spain) after the approval of the local ethics committee. Subjects were selected on the basis of postmortem diagnosis of AD according to neurofibrillary pathology and Aβ plaques. Control cases were considered those with no neurologic history and with no lesions in the neuropathologic examination. The time between death and processing was between 2 and 12 hours. A total of 50 samples were categorized into 4 groups ( Table 1 ).
Choroid Plexus Protein Sample Preparation
Choroid plexus was washed in phosphate buffer to remove blood contamination and then homogenized in lysis buffer (50 mmol/L Tris/HCl buffer, pH 7.4 containing 2 mmol/L EDTA, 0.2% Nonidet P-40, 1 mmol/L phenylmethylsulfonyl fluoride, protease and phosphatase inhibitor cocktails; Roche Molecular Systems, Pleasanton, CA) and centrifuged for 10 minutes at 14,000 rpm. The supernatant was recovered and stored at −80°C. The total protein concentration of each sample was measured using the Pierce BCA Protein Assay Kit (Thermo Scientific, Rockford, IL). Correct quantification was confirmed by loading 10 μg of each sample on a standard sodium dodecyl sulfate (SDS)–polyacrylamide gel electrophoresis and by subsequent Coomassie staining. One hundred microliters of samples were cleaned using 2D-Clean up kit (GE Healthcare Europe, Little Chalfont, UK). Pellets were then resuspended in 50 μL DIGE buffer (10 mmol/L Tris, 7 mol/L urea, 2 mol/L thiourea, 2% CHAPS). The DIGE experiment was carried out at the UCM-PCM Proteomics Facility, a member of ProteoRed-ISCIII network.
Differential 2D-DIGE
Four pools of protein extracts were generated according to AD-related pathology, stages I/II (70.9 ± 2.2 years), III to IV/0-B (74.7 ± 2.7 years), V to VI/B-C (76.4 ± 4.1 years), and age-matched controls (69.2 ± 3.1 years) by mixing equal amounts of choroid plexus extract for each of the corresponding subjects. The pools were prepared with samples from 4 male subjects from each group. One hundred micrograms of each pool was applied onto 24-cm strips (pH 3–11 NL; GE Healthcare) previously rehydrated in a solution containing 8 mol/L urea, 2 mol/L thiourea, 4% (vol/vol) CHAPS, 2% IPGphor buffer 3-11,and DeStreak reagent (GE Healthcare). The labeled samples were then applied to the strips by cup loading on a manifold-equipped IPGphor II IEF system (GE Healthcare). Isoelectric focusing was performed as follows: 120 V for 1 hour, 500 V for 2 hours, 500 to 2,000 V for 2 hours, 1,000 to 5,000 V for 6 hours, and 5,000 V for 10 hours. Before the second dimension run, the strips were equilibrated first for 12 minutes in equilibration buffer (100 mm Tris-HCl (pH 8.0), 6 m urea, 30% glycerol, and 2% SDS) with 2% dithiothreitol and then for 5 minutes in the same buffer supplemented with 2.5% iodoacetamide and 0.002% bromphenol blue. The equilibrated strips were transferred onto 12% homogeneous polyacrylamide gels (2.6% C) cast in low fluorescence glass plates using an Ettan DALTsix system (GE Healthcare). Electrophoresis was run at 2 W/gel overnight at 20°C. The differentially labeled coresolved proteins within each gel were imaged at a resolution of 100 dots/inch using a Typhoon 9400 laser scanner (GE Healthcare). Cy2-, Cy3-, and Cy5-labeled images of each gel were acquired at excitation/emission values of 488/520, 523/580, and 633/670 nm, respectively. Gels were scanned directly between the glass plates, and the 16-bit image file format images were exported for data analysis. After imaging for Cy dyes, the gels were removed from the plates and subjected to colloidal Coomassie staining.
Image Analysis
The DeCyder version 6.5 software (GE Healthcare) was used for spot detection and determination of quantity, intergel matching, and statistics. Detailed specifications of the method and software are available on the GE Healthcare Web site: ( https://www.gelifesciences.com/gehcls_images/GELS/Related%20Content/Files/1351095345757/litdoc29020301_20140929120112.pdf ). The differential in-gel analysis module was used for automatic spot detection and abundance measurements for each individual gel by comparing the normalized volume ratio of each spot from a Cy3- or Cy5-labeled sample to the corresponding Cy2 signal from the pooled sample internal standard. The differential in-gel analysis data sets for each individual gel were collectively analyzed using the biologic variation analysis module, which allows intergel matching and calculation of average abundance for each protein spot among the 8 gels of our study. Statistical significance was assessed for each change in abundance using Student t -test and analysis of variance analyses. We considered statistical significance to be at the 95% confidence level when standardized average spot volume ratios exceeded 1.3 in at least 7 of the 8 analyzed gels (i.e. 21 of the 24 analyzed images). Unsupervised principal component analysis, hierarchical clustering, and k -means clustering analyses were performed using the DeCyder extended data analysis module on the group of spots identified as significantly changed. These multivariate analyses clustered the individual Cy3- and Cy5-labeled samples based on collective comparison of expression patterns from the set of proteins. The groups of protein expression characteristics are represented by each data point in the principal component analysis plots and by each column in the hierarchical clustering expression matrixes. Mapping of proteins identified by MS, biologic association network analysis, and database search onto existing pathways and cellular networks was carried out using Pathway Studio 5.0 (Ariadne Genomics, Rockville, MD).
Protein Identification
The gel spots of interest were manually excised from the gels and transferred to microcentrifuge tubes. Samples selected for analysis were in-gel reduced, alkylated, and digested with trypsin according to Sechi and Chait ( 14 ). Briefly, spots were washed twice with water, shrunk with 100% acetonitrile (can), and dried in a Savant SpeedVac. Then samples were reduced with dithiothreitol and subsequently alkylated with iodoacetamide. Samples were digested with 12.5 ng/μL sequencing grade trypsin (Roche Applied Science) for at least 6 hours at 37°C. After digestion, the supernatant was collected and 1 μL was spotted onto a MALDI target plate (384-spot Teflon-coated plates) and allowed to air dry at room temperature. Subsequently, 0.5 μL of a 3-mg/mL solution of α-cyano-4-hydroxy- trans cinnamic acid matrix in 0.1% TFA and 50% ACN was added to the dried peptide digest spots and again allowed to air dry. The samples were analyzed using the MALDI-TOF/TOF mass spectrometer 4800 Proteomics Analyzer (Applied Biosystems, Framingham, MA) and 4000 Series Explorer software (Applied Biosystems). Matrix-assisted laser desorption/ionization–time-of-flight (MALDI-TOF) spectra were acquired in reflector positive ion mode using 1,000 laser shots per spectrum. Data Explorer version 4.2 (Applied Biosystems) was used for spectra analyses and to generate peak picking lists. All mass spectra were internally calibrated using autoproteolytic trypsin fragments and externally calibrated using a standard peptide mixture (Sigma-Aldrich). The TOF/TOF fragmentation spectra were acquired by selecting the 10 most abundant ions of each MALDI-TOF peptide mass map (excluding trypsin autolytic peptides and other known background ions) and averaging 2,000 laser shots per fragmentation spectrum. The parameters used to analyze the data were a signal-to-noise threshold of 20, a minimum area of 100, and a resolution higher than 10,000 with a mass accuracy of 20 ppm.
Database Search
The monoisotopic peptide mass fingerprinting data obtained from MS and the amino acid sequence tag obtained from each peptide fragmentation in MS/MS analyses were used to search for protein candidates using Mascot version 1.9 from Matrix Science. Peak intensity was used to select up to 50 peaks per spot for peptide mass fingerprinting and 50 peaks per precursor for MS/MS identification. Tryptic autolytic fragment-, keratin-, and matrix-derived peaks were removed from the data set used for the database search. The searches for peptide mass fingerprints and tandem MS spectra were performed in the Swiss-Prot release 53.0 and TrEMBL release 37.0 databases without taxonomy restriction, containing 269,293 and 4,672,908 sequence entries, respectively, for each software version and database release. Fixed and variable modifications were considered (Cys as S -carbamidomethyl derivate and Met as oxidized methionine, respectively), allowing 1 trypsin missed cleavage site and a mass tolerance of 50 ppm. For MS/MS identification, a precursor tolerance of 50 ppm and MS/MS fragment tolerance of 0.3 Da were used. Identification was accepted as positive when at least 5 matching peptides and at least 20% of the peptide coverage of the theoretical sequences matched within a mass accuracy of 50 or 25 ppm with internal calibration. In every case, probability scores were significant at p < 0.01.
Protein Quantification by Western Blot
Confirmation of the 2D-DIGE data was carried out using 1D Western blot. Choroid plexus samples from controls (n = 7) and AD-related pathology, stages I to II (n = 16), III to IV/0-B (n = 16), and V to VI/B-C (n = 11), were analyzed for immunoblot. Then the samples were washed to remove blood and dounce-homogenized in lysis buffer (50 mmol/L Tris/HCl buffer, pH 7.4 containing 2 mmol/L EDTA, 0.2% Nonidet P-40, 1 mmol/L phenylmethylsulfonyl fluoride, protease, and phosphatase inhibitor cocktails; Roche Molecular Systems) and centrifuged for 10 minutes at 14,000 rpm. The supernatant was recovered and stored at −80°C. Protein content was determined with the DC method (Bio Rad Laboratories, Inc., Hercules, CA). Equal amounts of protein (50 μg per lane) were separated by SDS–polyacrylamide gel electrophoresis (4%–12%) and transferred onto polyvinylidene fluoride membranes (Millipore). Nonspecific bindings were blocked by incubation in 5% nonfat milk in Tris-buffered saline (100 mmol/L NaCl, 10 mmol/L Tris, pH 7.4) containing 0.2% Tween for 1 hour at room temperature. Afterward, membranes were incubated overnight at 4°C with different antibodies in Tris-buffered saline (100 mmol/L NaCl, 10 mmol/L Tris, pH 7.4) containing 0.2% Tween with 3% bovine serum albumin. The antibodies used for these experiments included mouse anti-annexin V (1:1000; Abcam, Cambridge, UK), rabbit anti–aldehyde dehydrogenase ([ALDH] 1:100; Abcam), rabbit anti–14-3-3 β/α (1:200; Santa Cruz Biotechnology, Inc., Santa Cruz, CA), rabbit anti–14-3-3 ε (1:1000; Abcam), rabbit anti-moesin (1:5000; Abcam), and goat anti–proteasome activator complex subunit 1 ([PSME1] 1:1000; Abcam). Protein loading was monitored using a mouse monoclonal antibody against β-actin (1:10,000; Sigma-Aldrich, St. Louis, MO). Membranes were then incubated for 1 hour in the appropriate horseradish peroxidase–conjugated secondary antibodies (1:2000; Dako Agilent Technologies, Glostrup, Denmark), and immunocomplexes were revealed by an enhanced chemiluminescence reagent (ECL Clarity; BioRad). Densitometric quantification was carried out with ImageQuant TL Image Analysis software version 7.0 (LAS 4000; GE Healthcare) ( www.ym.edu.tw/ymirc/list/ImageQuant_TL_Plus.pdf ). Protein bands were normalized to β-actin levels and expressed as the percentage of the control group level. Each experiment was analyzed 3 times in separate blots.
Data and Statistical Analyses
Results are expressed as means ± SEM. Statistical analyses were performed with 2-way analysis of variance followed by post hoc Tukey test for multiple comparisons using SPSS version 15.0 software. Statistical significance was set at p < 0.05.
Results
Differential Analysis of Choroid Plexus Protein Expression
To identify choroid plexus proteins associated with disease, we first performed a discovery-phase proteomics experiment using 2D-DIGE. The 2D-DIGE study designs of the choroid plexus from human autopsy sample pools are shown in Figure 1 . By comparing control samples (a pool with samples of nondemented subjects) with pools from other groups (3 pools containing samples from patients with AD-related pathology, stages I–II, III–IV, and V–VI) and the AD groups with each other, we consistently obtained more than 2,000 spots that were compared with each other using analysis software. Merged 2D-DIGE images are shown in Figure 2 A, each corresponding to pairing a control sample and a sample from patients with AD-related pathology, resulting in 8 gels with Cy3 and Cy5 superimposed images (Table, Supplemental Digital Content 1, Supplementary Data ).
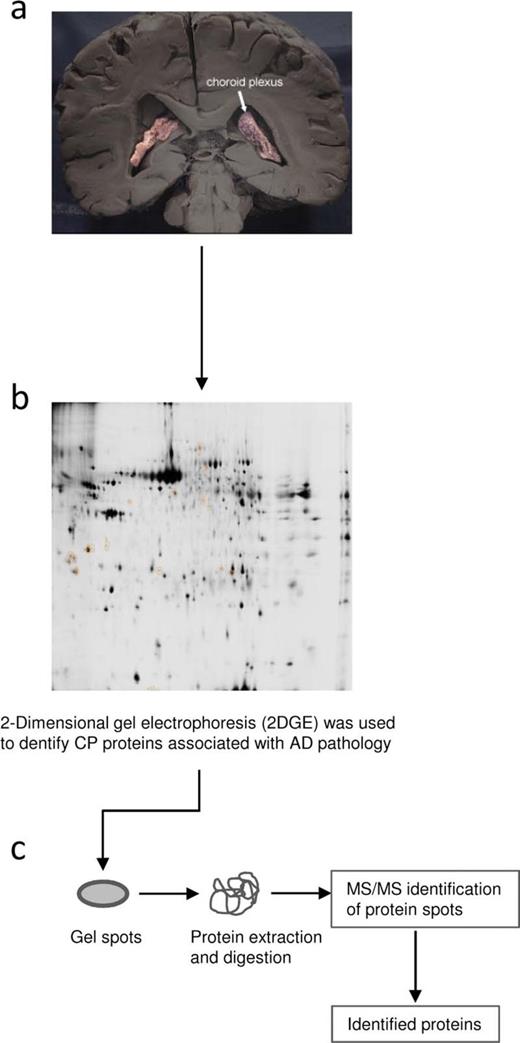
Study design. Schematic diagram of the design of discovery-phase study for the identification of choroid plexus–based Alzheimer disease (AD) biomarkers associated with the rate of disease progression. ( A ) Samples used for the proteomic study: choroid plexus from AD-related Stages I to II, III to IV, and V to VI and healthy control subjects. ( B ) Two-dimensional difference gel electrophoresis (2D-DIGE) analyses were performed to determine changes in protein expression. ( C ) Appropriate spots were excised, and proteins were identified by MS analysis.
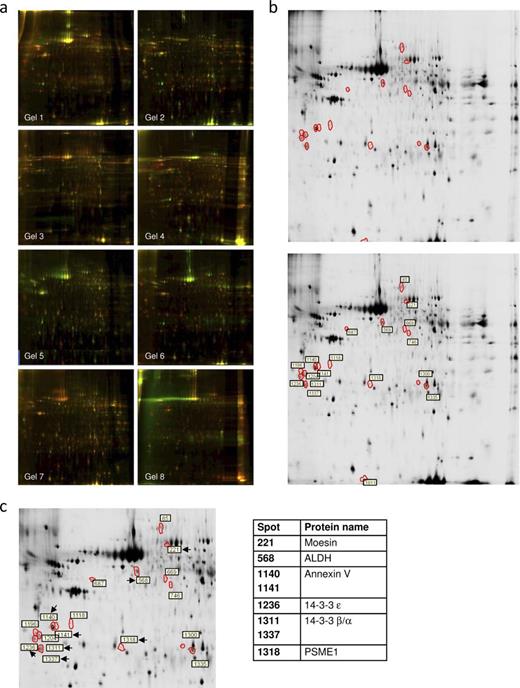
Proteomic discovery-phase study of choroid plexus proteins associated with Alzheimer disease (AD)–related pathology. ( A ) Two-dimensional difference gel electrophoresis (2D-DIGE) analysis gel images with superposition of Cy3 and Cy5 dyes, corresponding with pairing a control sample and a sample from patients with AD-related pathology. ( B ) Images representing choroid plexus protein expression on 2D gels from control subjects (top panel) and AD (bottom panel). Differently regulated spots are surrounded by red borders, and spot numbers are highlighted by white boxes. ( C ) Zoomed area with the selected spots is shown. Proteomic identification of choroid plexus proteins associated with AD progression is present on the right.
In the first analysis, searching for spots that had a significantly higher spot volume (at least 1.3 times different) and spots in the group comparison that obtained a value of p < 0.05, we obtained 18 candidate spots matching the criteria. Figure 2 B represents images of 2 analytical gels run with choroid plexus samples from healthy control (top) and AD (bottom) groups. The differently regulated spots (identified after image analysis) are surrounded by white borders.
Using MS/MS analyses, we were able to identify 8 out of the 18 spots as 14-3-3 β/α (in 2 spots), 14-3-3 ε, moesin, PSME1, annexin V (in 2 spots), and ALDH ( Fig. 2 C). The 14-3-3 β/α and annexin V were identified in more than 1 spot ( Fig. 2 C; Table 2 ). Thus, these 8 spots account for only 6 distinct proteins. The remaining 10 spots were impossible to identify because of unclear results or low protein levels. Expression of the 6 identified proteins is modified between groups. Whereas ALDH and annexin V are upregulated in stages I to II compared with control subjects, moesin, 14-3-3 β/α, 14-3-3 ε, and PSEM1 are downregulated in these early AD stages I to II ( Table 2 ). Curiously, moesin, 14-3-3 β/α, and 14-3-3 ε expression tends to increase in advanced AD stages, being statistically significant in stages III to IV compared with stages I to II.
Choroid Plexus Proteins Identified by 2-Dimensional Difference Gel Electrophoresis
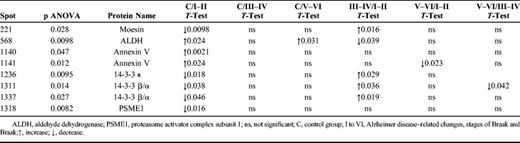
Choroid Plexus Proteins Identified by 2-Dimensional Difference Gel Electrophoresis
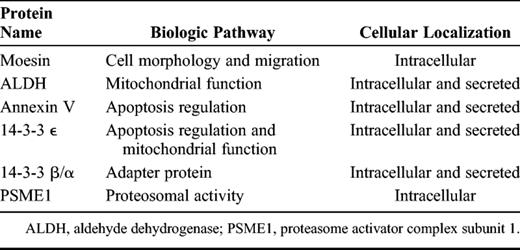
Table 3 shows the identified proteins grouped according to their cellular localization and biologic function in normal physiologic conditions. The 14-3-3 β/α, 14-3-3 ε, annexin V, and ALDH have been reported to be regulated in neuronal cells in AD patients ( 14–18 ), but their roles and modulation were unknown in AD choroid plexus. In addition, in the present study, moesin and PSME1 are identified as proteins regulated in AD patients for the first time.
Choroid Plexus Proteins Identified by 2-Dimensional Difference Gel Electrophoresis
Choroid Plexus Proteins Identified by 2-Dimensional Difference Gel Electrophoresis
Confirmation of Protein Expression by Western Blot
Protein samples from choroid plexus corresponding to individual healthy subjects and patients with AD-related pathology were analyzed with Western blot to estimate the content of each protein previously detected by 2D-DIGE. Representative experiments with samples analyzed for 14-3-3 β/α, 14-3-3 ε, moesin, PSME1, annexin V, and ALDH expression in males and female AD patients and controls are shown in Figures 3 and 4 . The general patterns of expression of all these proteins were similar between male ( Fig. 3 ) and female ( Fig. 4 ) samples, although the differences were more marked in male subjects. As shown in Figures 3 and 4 , the intensity of the β-actin signal was similar for all samples and was therefore used as an internal reference for cross-sample normalization.
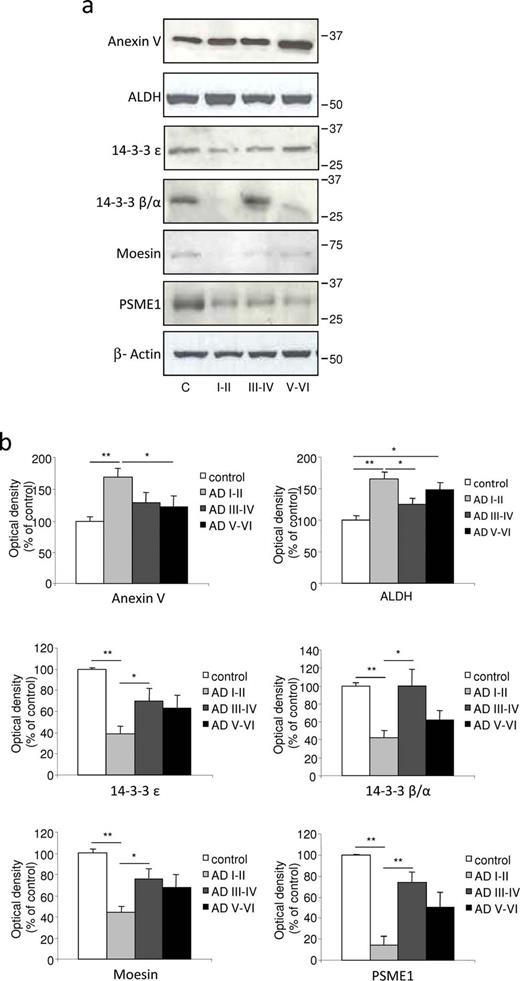
Confirmation of protein expression analysis in differential 2D electrophoresis (2D-DIGE) with Western blot quantification in the choroid plexus from male samples. ( A ) Choroid plexus lysates of control and Alzheimer disease (AD) patient groups were tested with Western blot and immunoblotted with specific antibodies. The expression levels of annexin V and ALDH were significantly upregulated, whereas 14-3-3 ε, 14-3-3 β/α, moesin, and PSEM1 were downregulated in the choroid plexus from patients in early AD stages I to II. ( B ) Intensity of protein bands was quantitated by densitometric analysis and normalized to the amount of β-actin. Data are expressed as mean ± SE; * p < 0.05, ** p < 0.01, n = 3 independent experiments.
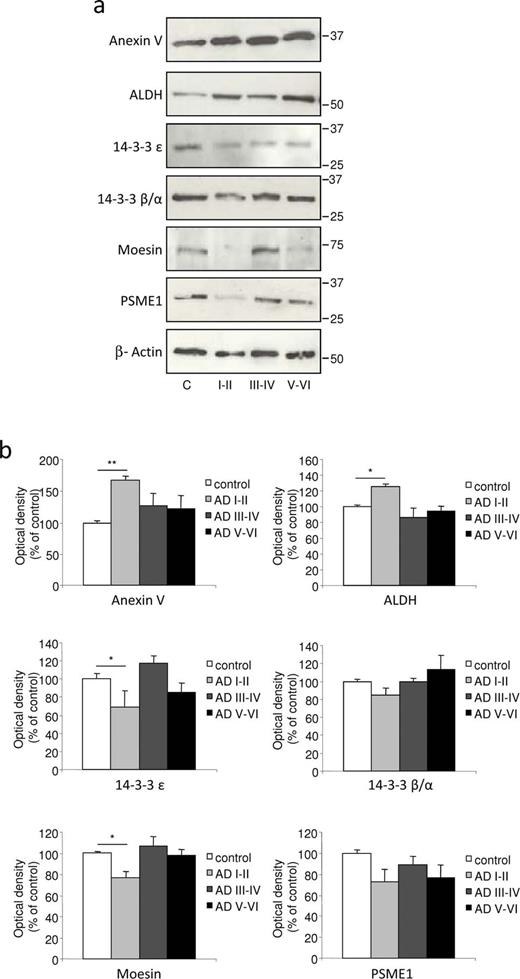
Confirmation of protein expression analysis in differential 2D electrophoresis (2D-DIGE) with Western blot quantification in choroid plexus from female samples. ( A ) Choroid plexus lysates of control and Alzheimer disease (AD) patient groups were tested with Western blot and immunoblotted with specific antibodies. The expression levels of annexin V and ALDH were significantly upregulated, whereas 14-3-3 ε and moesin were downregulated in choroid plexus from patients in early AD stages I to II. ( B ) Intensity of protein bands was quantitated by densitometric analysis and normalized to the amount of β-actin. Data are expressed as mean ± SE; * p < 0.05, ** p < 0.01, n = 3 independent experiments.
On quantification and normalization to the β-actin signal, the expression of annexin V and ALDH in male choroid plexus samples from AD-related pathology corresponding to Braak stages I to II was significantly higher than that in control subjects (63% and 58%, respectively; Fig. 3 A, B), an increase in accordance with the data obtained by 2D-DIGE ( Table 2 ). In female choroid plexus samples, this increase in annexin V and ALDH expression was 65% and 26%, respectively ( Fig. 4 A, B). Regarding 14-3-3 isoforms, densitometric analysis showed that their expression was reduced in male choroid plexus samples from AD-related pathology corresponding to Braak stages I to II compared with control subjects (reduction of 61% for 14-3-3 ε and 56% for 14-3-3 β/α; Fig. 3 A, B), in accordance with 2D-DIGE data. In female choroid plexus, these changes were less pronounced and only 14-3-3 ε was significantly reduced by 31% in patients with AD-related pathology at Braak stages I to II ( Fig. 4 A, B). Finally, the expression of moesin and PSME1 was also validated by Western blot, showing that their expression was decreased in male (85% and 47%, respectively; Fig. 3 ) and female (33% and 15%, respectively; Fig. 4 ) choroid plexus samples from AD Braak stages I to II versus control samples.
Discussion
The present findings represent one of the first proteomic analyses of the choroid plexus from patients with AD-related pathology (stages I–VI of Braak) and healthy subjects. Choroid plexus is involved in the clearance of brain Aβ from the CSF to the bloodstream ( 5, 15, 16 ). The ability of the choroid plexus to secrete Aβ-carrier proteins and to express important receptors that scavenge amyloidogenic peptides decreases with age and is compromised in several models of AD ( 17–19 ). The accumulation of Aβ 1–40 and Aβ 1–42 peptides in choroid plexus epithelial cells is, to a great extent, responsible for an increased level of oxidative stress and cell death ( 5, 6 ). A decrease in the metabolic activity of choroid plexus epithelial cells is in part correlated with Aβ-induced mitochondrial dysfunction ( 5, 20 ).
In line with these observations, we used the 2D-DIGE electrophoresis technique to identify qualitative and quantitative differences in protein expression from choroid plexus from biologic samples of patients at different stages of AD pathology. We identified 6 proteins of which expression is altered in choroid plexus of patients with AD-related pathology. These changes were particularly pronounced at the early stages of the disease. Proteins identified in the present study could be grouped according to their key biologic pathway as involved in apoptosis regulation and/or mitochondrial function. Oxidative damage to proteins and the decrease in mitochondrial function are relatively early phenomena in the pathogenesis of AD. For instance, oxidative damage to ATP synthase accompanied by decreased ATP synthase activity has been observed in the entorhinal cortex in cases with AD-related pathology at stages I to II of Braak ( 21 ).
In the present study, we observed a decrease in 14-3-3 ε at the early Braak stages I to II. Reduction of 14-3-3 ε expression was detected with proteomic analysis in neonatal rat hypoxia/ischemia ( 22 ) and, more recently, 14-3-3 ε has been reported to protect the mitochondrial membrane potential ( 23 ). The highly conserved and ubiquitously expressed 14-3-3 protein isoforms are known to be involved in the regulation of enzyme activity ( 24 ) and prevention of the initiation of programmed cell death ( 25 ). Thus, in accordance with these published studies, we suggest that the reduction of 14-3-3 ε and 14-3-3 β/α results in the neural tissues being vulnerable to damage.
The 14-3-3 protein isoforms also act as adaptor molecules to stimulate protein-protein interactions ( 24 ) and may interact with ezrin/radin/moesin proteins ( 26 ). Ezrin/radin/moesin proteins play a crucial role in the maintenance of cell-to-cell adhesion, cell shape and motility, and membrane trafficking ( 27 ). In the present study, expression of moesin, a member of this ezrin/radin/moesin family of proteins, has also been found to be decreased in the choroid plexus at early stages of AD pathology. These data suggest that a dysfunction in cytoskeletal organization in the choroid plexus epithelial cells may be related to the decline in blood-CSF barrier properties in AD.
Two proteins related to apoptosis regulation and mitochondrial function, annexin V and ALDH, showed increased levels in AD-related pathology at stages I to II of Braak. Annexins (I–V) are a family of structural proteins widely distributed among tissues and, although annexin I expression has been described in choroid plexus ( 28, 29 ), little is known about the expression or role of annexin V in this structure. Previous studies of annexin V showed this protein to be a proapoptotic marker ( 16 ), but it has also been suggested that it protects against vascular inflammation, contributing to barrier integrity, and blocks Aβ-induced neurotoxicity ( 30, 31 ).
The activity of the antioxidant enzyme ALDH has been reported to be significantly increased in the putamen ( 32 ) and the temporal cortex ( 33 ) of patients with AD compared with age-matched controls, suggesting that increased ALDH activity could be a protective response of the brain in AD. This protective reaction may act to compensate for the choroid plexus mitochondrial dysfunction previously described by our group ( 5 ).
Numerous neurodegenerative diseases share a common feature, namely, the accumulation of aberrant proteins in intracellular inclusions, suggesting a failure in the ubiquitin-proteasome system, the principal intracellular mechanism responsible for the degradation of abnormal or “unwanted” proteins ( 34, 35 ). In AD, proteasome dysfunction or loss of proteasome activity has been reported in the autopsied brain ( 36, 37 ), probably resulting, at least in part, from altered proteasome expression ( 38 ). In the current study, reduced expression in the α subunit of the proteasome activator complex PA28, or PSME1, observed in AD-related pathology at stages I to II of Braak, suggests proteosomal dysfunction at the choroid plexus level.
In summary, we suggest that the expression of damage-related proteins, including 14-3-3 ε and 14-3-3 β/α and other proteins such as moesin and PSEM1, decreases at the early Braak stages I to II. Simultaneously, these morphologic and functional alterations may be, at least in part, compensated by increased levels of protective proteins, such as annexin V and ALDH, because in stage I to II cases, there are no neurologic symptoms. However, we found that this balance between damage and protective biomarkers tends to disappear in advanced AD stages. Our findings suggest that these proteins might have important mechanistic implications in the earliest stages of the disease.
In conclusion, the present study allowed us to identify a set of 6 proteins altered in the choroid plexus of patients with AD-related pathology compared with healthy subjects. The identified proteins belong to proteins involved in apoptosis regulation and mitochondrial functions and in normal physiologic conditions are located intracellularly, and 4 of them are also secreted. The present findings validate preliminary data reported by our group describing choroid plexus dysfunction in AD ( 5, 6 ). Proteomic approaches offer a detailed description of molecular changes associated with sex, aging, and AD, providing new information about metabolic and functional changes in the choroid plexus and their evolution along AD pathogenesis. Because some of these identified proteins are secreted into the extracellular environment, this impaired protein pattern could be reflected in the CSF, resulting in new potential biomarkers; however, this hypothesis requires further study. To date, plasma annexin V levels have been proposed as a possible biomarker for AD and dementia with Lewy bodies ( 39 ). Furthermore, the detection of 14-3-3 in the CSF represents an important approach in the identification of Creutzfeldt-Jakob disease ( 40, 41 ).
The diagnostic guidelines of AD have recently been updated to include brain imaging and CSF biomarkers ( 42 ), with the aim of increasing the certainty of whether a patient has an ongoing AD neuropathologic process. The CSF biomarkers total tau and hyperphosphorylated tau, and the 42 amino acid isoform of Aβ (Aβ 1–42 ), are currently used as diagnostic biomarkers, reflecting the core pathologic features of AD ( 43 ). Amyloid β and hyperphosphorylated tau have deleterious effects on mitochondrial function ( 44 ). Although Aβ levels are reduced in CSF, its expression is increased in the choroid plexus ( 4, 9 ), where it induces cytotoxic effects ( 5, 6 ). Thus, we hypothesize that protein changes observed in the current study may be associated with the altered expression of Aβ. We cannot exclude the possibility that Aβ accumulation appears after, and possibly in consequence to, the changes in the expression of these proteins in the choroid plexus.
Because the proteins investigated in this study show changes in expression at the earliest stages of the disease, they have the potential to be useful as biomarkers, which would allow identification of the disease at a crucial point in its development. The changes in expression also suggest important functions of these proteins in the progression of the disease. Further study of the proteins identified in this study should shed more light on the early pathogenic mechanisms occurring in the choroid plexus in AD.
Acknowledgment
The authors thank Tom Yohannan for careful revision of this article.
References
Supporting Information
Author notes
This work was supported by grants from Instituto de Salud Carlos III (FIS2009/01636, FIS2012/00486), Fundación Investigación Médica Mutua Madrileña (2010/0004), Fundación Ramón Areces (CIVP16A1825), and CIBERNED (BESAD-P.2010).
Supplemental digital content is available for this article. Direct URL citations appear in the printed text and are provided in the HTML and PDF versions of this article on the journal’s Web site ( www.jneuropath.com ).
